Getting started with KLayout
Notes from MOSAIC Bootcamp talk by Matthias Koefferlein. See repos here. KLayout started as a viewer for GDS2 files. Has since gotten features for Editing, Scripting, PCells, File Formats, APIs, Analysis + Verification, Python Modules.
Starting out
You need to launch klayout with -e to start in editor mode
klayout -e
In order to always start in editor mode, you can go to File>Setup>Application>Editing Mode>Check always start in editor mode.
To create a new layout, go to File>New Layout. You need to specify layers, but for now just do 1,2,3 for the layers.\
Drawing a box
Select a layer on the right, click box, and then click two points on the canvas.
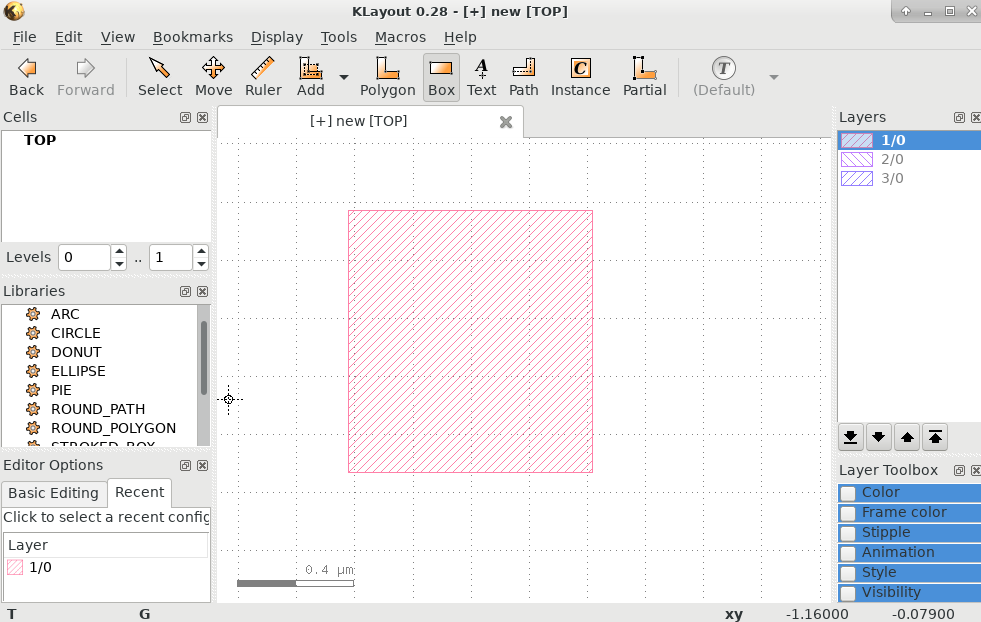
To leave box editing mode, just press escape.
Zoom controls
Mouse wheel zooms as normal. Click and drag with right click zooms to the area you specify.
Enabling the axes
Setup>Background>Axis>Style=Lines
Coloring
You can set the color of specific layers from layer toolbox > color. You can also edit the stipple patterns of layers. (See Layer Toolbox)
Background
File>Setup>Display>Background>Background Color
Changing the layer of a shape
- Select the shape
- Edit>Selection>Change Layer
Customizing Shortcuts
File>Setup>Customize Menu>Find Command>Set keyboard shortcut on the right panel.
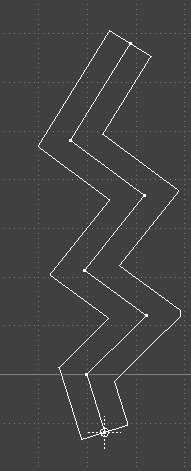
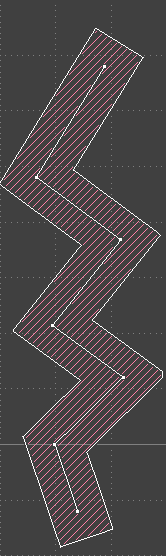
Drawing Paths
Paths are basically lines with specified widths. Use the path tool and specify corners for your path.
 |
 |
|---|---|
Notes: Pressing SHIFT restricts movement to horizontal and vertical. CTRL allows diagonals.
Editor Options
Pressing F3 opens the editor options. If you set Angle Contraints > Connections to Manhattan, that will automatically restrict paths to only vertical and horizontal lines.
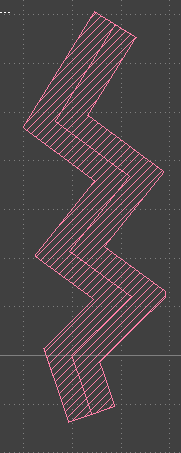
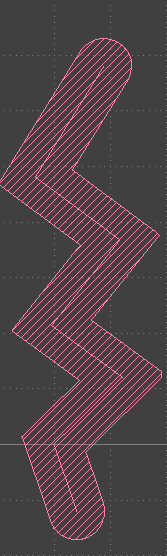
Extension Types
Pressing Q while a path is selected and selecting an extension type gives you the option to specify what happens at the end of paths.\
 |
 |
|---|---|
| Square | Round |
Moving selections: Use partial editing
If you select the partial editing tool, you can change portions of an already existing shape.
Inserting Points in the path
While using Partial tool, double click a point in a path. This creates a new point. You can then use the partial tool to further move the point.
Copy Paste
Try CTRL+C CTRL+V
Putting in Skywater into KLayout
github.com/klayoutmatthias/si4all\
- tech.lyp - file that styles all the layers for a particular technology
PCells
Creating New Cells
Edit > Cell > New Cell
Draw stuff in that cell. Set TOP as top again (right click).
Now click and drag the cell you made into the canvas. It should show
something like this.
 |
|---|
| VIA subcells dropped onto TOP cell |
You can edit the subcell from top level, and it will change all the subcells instances in top.
Accidents can happen when you can do that, so you may di View > Select only top level.
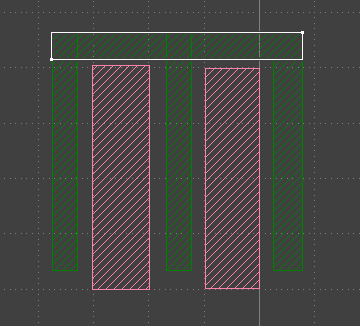
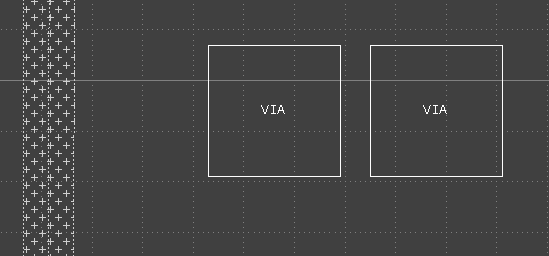
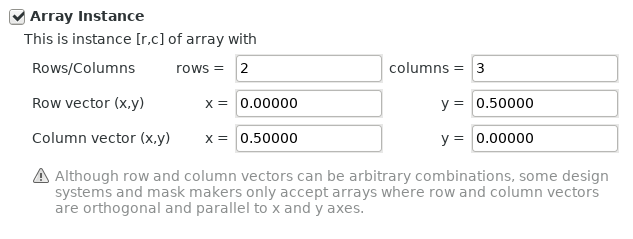
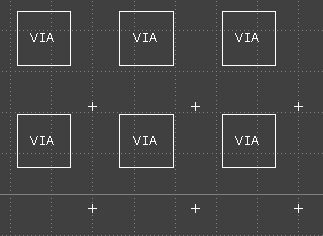
Array Instances
Double click on a PCell (or select and press Q). Check array instance, specify the number of instances in rows/columns and then specify the spacing.
 |
 |
|---|---|
| Specification inside instance properties | Via array |
Note that this uses the PCell origin (0,0) position to place the array.
Scripting
- Automates layout generation
- Extends to custom features
- Coding PCells
- Layout Analysis
- Verification Workflow (DRC and LVS)
Klayout supports Ruby and Python.
KLayout integrated IDE
We can use the integrated IDE inside KLayout for Python scripting. Press F5 or Macros > Macro Development.
KLayout is usable as a Python interpreter. See: Link
Click the + inside the Macro Development window > Select General KLayout Macro as Macro Template.
import pya
print("Hello World")
Coordinates
(x,y) tuples represent coordinates.
Four classes for coordinates:
- Points and Vectors
- Floats and Integers
Points are locations, vectors are point differences.
Floats are micrometers by convention. Integers are database units by convention (always need to know what the database unit is).
Database Units
In GDS, every coordinate is an integer multiple of the “database unit”- typically 1nm or fractions thereof.
Coordinates are then 32 bit integers, so coordinate space is limited. Also then rounding effects happen.
Coordinate Classes
Point
pya.Point(100,200)
Vector
pya.Vector(100,200)
v = p2 - p1
DPoint
pya.DPoint(1.5,0.25)
DVector
pya.DVector(1.5,-00.5)
v = p2 - p1
Inserting into canvas
Insert the code below into your macro:
import pya
global canvas

class Canvas(object):

  def __init__(self, layer = pya.LayerInfo(1, 0)):
    self.layer = layer

  def _layout(self):
    pya.LayoutView.current().cancel()
    ly = pya.CellView.active().layout()
    if not ly:
      raise Exception("No layout available")
    return ly

  def insert(self, x):
    ly = self._layout()
    shapes = ly.top_cell().shapes(ly.layer(self.layer))
    shapes.insert(x)

  def clear(self):
    ly = self._layout()
    ly.clear_layer(ly.layer(self.layer))

canvas = Canvas()
and then run it (Shift + F5). In the interactive terminal,
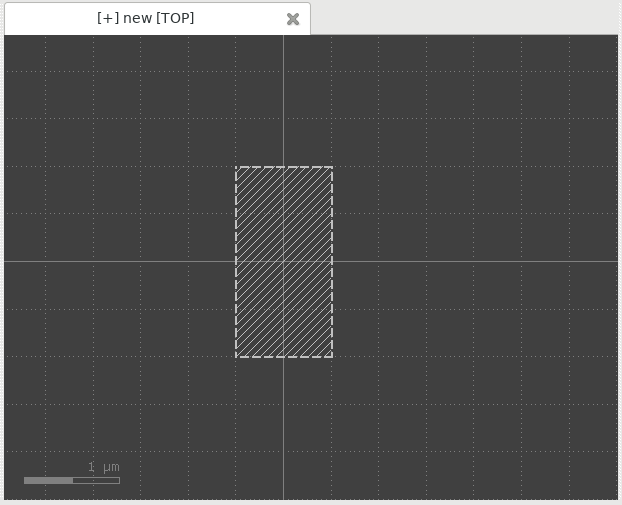
b = pya.DBox(-0.5,-1,0.5,1)
canvas.insert(b)
This should insert a square in the middle of your canvas.
 |
|---|
| Scripted box |
For more information on the scripting API, go to Help > Assistant > Programming Scripts.
Objects
Boxes
Get the intersection of two boxes, and return it as a box object as well.
b1 = pya.DBox(0,0,2,3)
b2 = pya.DBox(1,2,3,4)
canvas.clear()
canvas.insert(b1)
canvas.insert(b2)
b3 = b1 & b2
canvas.insert(b3)
print(b3)
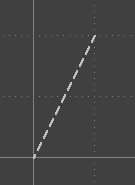
Edges
Edges connect two points. Note: these don’t have GDS2 equivalents, they are mapped to 0-width paths
canvas.clear()
e = pya.DEdge(pya.DPoint(0,0),pya.DPoint(1,2))
canvas.insert(e)
 |
|---|
| Result |
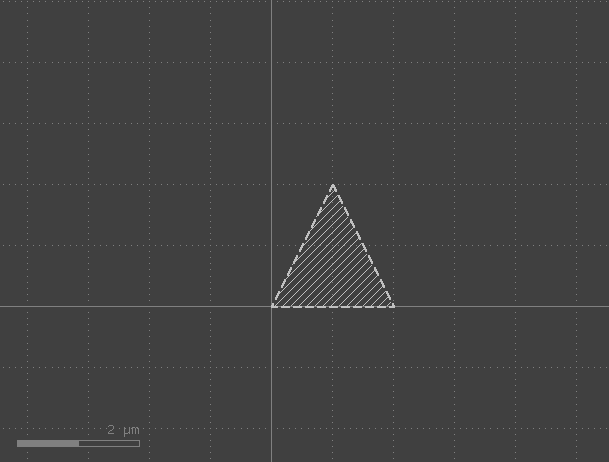
Polygons
Made from lists of points.
- Simple Polygon
- Cannot have holes
- Simply connected
- Polygon
- Can have holes
Polygons decompose into a number of connected Edge objects.
canvas.clear()
p = [pya.DPoint(0,0), pya.DPoint(1,2), pya.DPoint(2,0)]
poly = pya.DPolygon(p)
canvas.insert(poly)
 |
|---|
| Result |
p.append(pya.DPoint(1,-2))
poly2 = pya.DPolygon(p)
canvas.insert(poly2)
 |
|---|
| Result |
Ellipses!
poly3 = pya.DPolygon.ellipse(b)
canvas.insert(poly3)
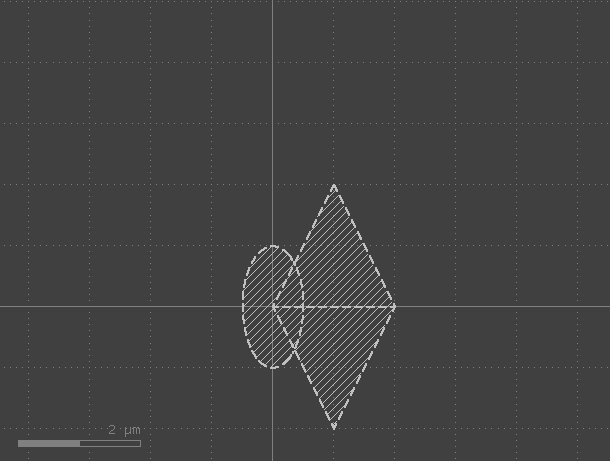 |
|---|
| Result |
Note: takes a DBox object as input.
Insert hole.
bh = pya.DBox(-0.2,-0.2,0.2,0.2)
poly3.insert_hole(bh)
canvas.clear()
canvas.insert(poly3)
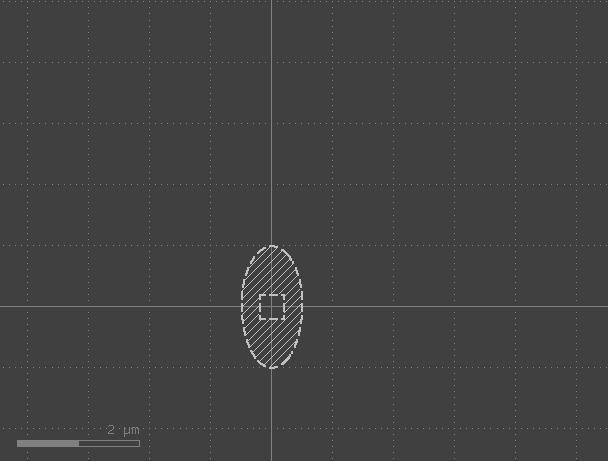 |
|---|
| Result |
Inspecting the effects of GDS export on polies with holes.
- File > Save As > name.gds.
- Close the layout
- Open the GDS file
 |
|---|
| Result |
GDS always needs connection lines for holes inside polygons. KLayout does this automatically for you when you export. Polygons with holes are not supported objects by GDS, so when saving to GDS, Polygon objects are transformed into SimplePolygon objects, which causes this cutline to be created.
Paths
canvas.clear()
p = [pya.DPoint(0,0), pya.DPoint(1,2), pya.DPoint(2,0)]
path = pya.DPath(p,0.2)
canvas.insert(path)
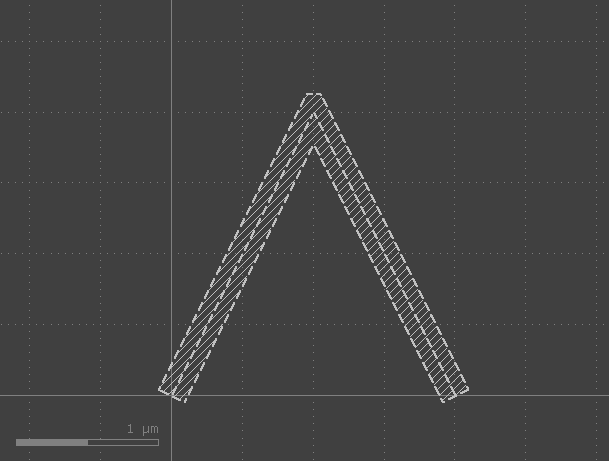 |
|---|
| Result |
Notes: Don’t make acute angles with paths unless you want to fight the fab.
Text
“Texts are funny objects by the way.” - Matthias
Texts are attached to points, and put a text string on these points. Often used to attach net names.
This gives LVS tools hints as to what net names to match with nets.
Region
A collection of polygons. (Just like powerpoint groups). So basically disjoint sets
Supports:
- DRC Features
- Booleans
- Selection
- Clipping
- Poly Manipulations
- Sizing
Note: Only integer objects.
Transformations
These represent a transformation matrix $M$ and a displacement $(s_x,s_y)$
- Simple Affine
Shift, rotate (90 multiples only), mirror, scale.
- Complex
- ICplxTrans (integer displacement)
- DCplxTrans (float displacement)
- CplxTrans (int > float displacement)
- VCplxTrans (float > int displacement)
# Only shift transformation.
t = pya.DTrans(2.0,3.0) #.0 is important to turn it into a shift op.
canvas.insert(t * path)
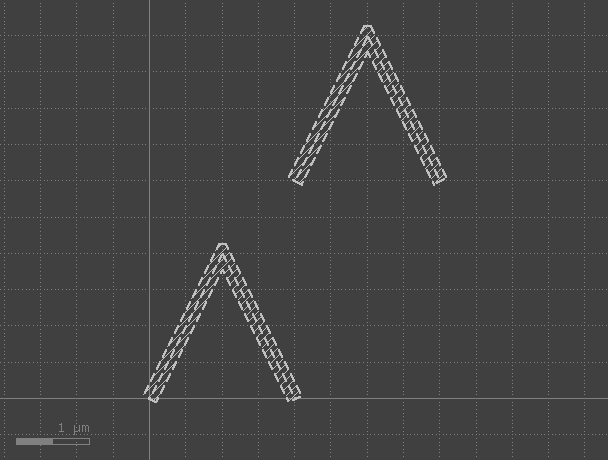 |
|---|
| Result |
Usage: pya.DTrans(rotations in multiples of 90, BOOL for mirroring in x before rotation, shift tuple OR vector). If floats are specified then it automatically becomes shift.
Complex transformations are mainly used to shift between the integer and float units:
Micrometer to DBU:
dbu = 0.005
dp = pya.DPolygon(pya.DBox(0,1,2,3))
p = pya.CplxTrans(dbu).inverted() * dp
Displaying a layout object
import pya
global display

class Display(object):

  def __init__(self):
    self.view_index = None

  def show(self, layout):
    mw = pya.Application.instance().main_window()
    if not self.view_index is None:
      mw.view(self.view_index).close()
    self.view_index = mw.create_view()
    view = mw.view(self.view_index)
    view.show_layout(layout.dup(), False)

display = Display()
Layout Programming in Steps
- Create a layout
- Define Layers
- Create a top cell
- Get Shapes container
- Insert Shapes
- Show Layout
ly = pya.Layout()
ly.dbu = 0.001 #1nm
l1 = ly.layer(1,0)
top = ly.create_cell("IOP") #pya.Cell object
shapes = top.shapes(l1)
b = pya.DBox(1,2,3,4)
shapes.insert(b)
display.show(ly)
ly.write("x.gds")